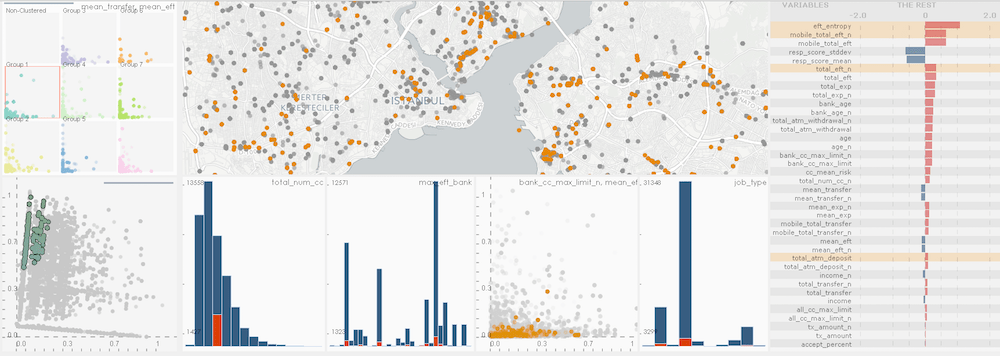
In interactive data analysis processes, the dialogue between the human and the computer is the enabling mechanism that can lead to actionable observations about the phenomena being investigated.
Visual analytics can be considered as an interactive and iterative dialogue between the human and the computer where the interactive analysis process is a sequence of actions by the user and responses by the computer motivated by an analytical question. In the case of visual analytics methodologies, the input from the user is often an interactive modification either to trigger a change in the state of a visualization, or to change the conditions of how a particular computation is carried out, e.g., changing the set of features that goes into a clustering algorithm.
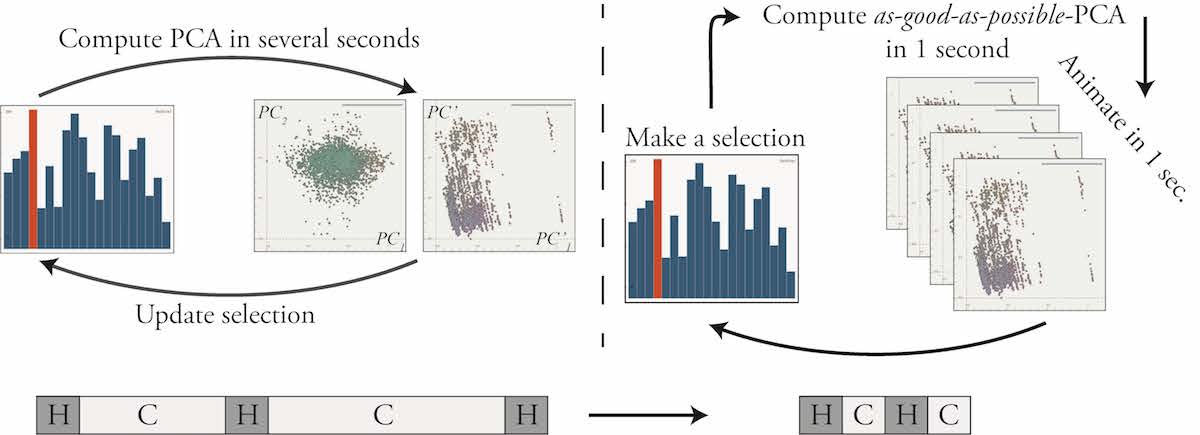
In interactive data analysis processes, the dialogue between the human and the computer is the enabling mechanism that can lead to actionable observations about the phenomena being investigated. In cases where the analysis involve an integrated computational method, for instance to reduce the dimensionality of the data or to perform clustering, such non-optimal processes are often likely. With our approach, we take a step to realize one of the recommendations in Illuminating the Path by Thomas and Cook, that reads “. . . identify and develop interaction techniques that address the rational human timeframe.”
Our arguments and decisions here are informed by observations gathered over a series of workshops with analysts from finance. We also demonstrate our approach on an additional use-case and evaluate the methods on financial analysis tasks carried out with our collaborators.
We document observations and recommendations from this case study and present evidence on how our approach contribute to the efficiency and productivity of interactive visual analysis sessions involving high-dimensional data.


